Sample Database Extraction
Data maintained in Origins is available, free of charge, to anyone with Internet
access. This section provides a step-by-step guide for accessing and extracting information from an
Origins database. Once the site has been accessed, user wishing to create their own custom data extraction from one of the 26
Origins databases should follow the “Database” link from the from the Origins
Home Page located in the Main Menu at the top of the page.
Selecting this button will display the Origins
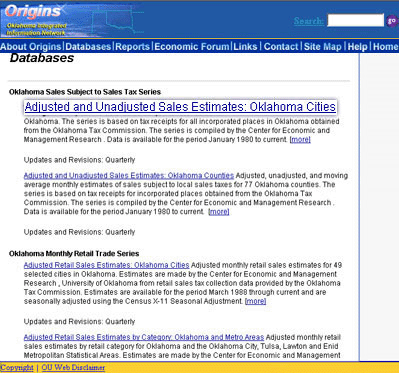
Databases Page as displayed in Figure 1. Currently, there are a total of 18 databases
residing on the system. Each listing contains a hyperlink to gain access to the systems
and a short description of the content of the database. Complete documentation for each
database may be obtained by selected the [more] button located at the end of each database
description.
Figure 1. Database Page

To gain access to any of the databases listed, simply scroll through the page and click on
the hyperlink for the appropriate database.
For this example, we chose the first entry listed on the page, the Adjusted and Unadjusted Sales Estimates – Oklahoma Cities database.
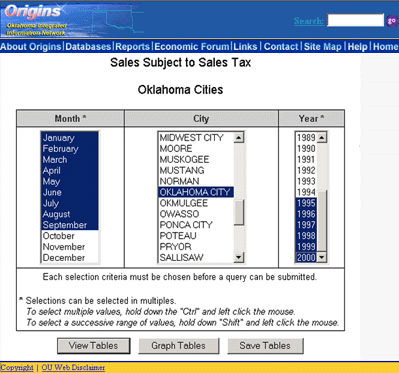
Selecting this link brings up the page illustrated in Figure 2.
Figure 2. Database Interface

Each database contains a similar interface in which the user selects the desired time interval
and specific geography. In this example, we are extracting Sales Subject to Sales Tax for
Oklahoma City for the period January through February for the years 1995 through 2000.
Once time and geography dimensions have been selected, the user may chose between one of
three data retrieval options listed along the bottom of Figure 6. First, users are given
the option of viewing a data table containing their selections or they may choose to
download the information onto their own personal computer.
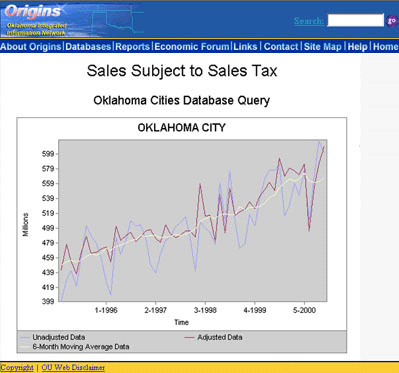
The third option is to view the data as a graphical representation as shown in Figure 3.
Choosing the graphing option allows the Origins user to quickly identify existing strengths
and weaknesses as well as identify local trends within an local economy.
Figure 3.

|